100% Zufriedenheitsgarantie Sofort verfügbar nach Zahlung Sowohl online als auch als PDF Du bist an nichts gebunden
logo-home
Plenary lecture notes Econometrics 5,49 €   In den Einkaufswagen

Notizen

Plenary lecture notes Econometrics

 18 ansichten  1 kauf
  • Kurs
  • Hochschule
  • Book

Plenary lecture notes Econometrics Radboud University

vorschau 4 aus 59   Seiten

  Zum Beispiel

Dein Dokument wird erstellt...

mobile-preview
  • 19. märz 2019
  • 59
  • 2018/2019
  • Notizen
  • Unbekannt
  • Alle klassen
avatar-seller
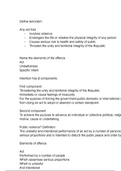
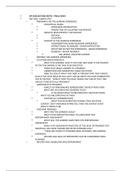
Lecture 1
04-02-2019

Chapter 1: an overview of regression analysis
• Why study econometrics?
o “It fills a gap between being a student of economics and being a practicing economist”.

1.1 What Is Econometrics?
In economics we express out ideas about relationships between economic variables using mathematical
functions.
• c = f(yd)
o Consumption as function of disposable income
• q = f(p, ps, pc, yd)
o Demand for a specific type of car (Honda Civc) as function of its price, the price of other cars
(substitutes), the price of complements (like petrol) and disposable income

1.2 What is regression analysis?
• Besides the number of sold Honda Civic cars (the dependent variable) that is caused by the
independent variables (p, ps, pc, yd), there is almost always variation that comes from other sources as
well.
• β0 + β1p + β2ps + β3pc + β4yd + e
• A random (stochastic) component (e, error term) is added to the regression equation as well to
introduce all variation that cannot be explained by the independent variables (Xs).

Single Equation Linear Models
• Y = β0 + β1 X (1.3)
o slope (hellingshoek) is constant
• Y = β0 + β1 X2 (1.4)
o slope is not constant
• (slope = first derivative dy/dx)

Extending the Notation
• Yi = β0 + β1 Xi + εi (i = 1,2, …,N) (1.10)
• As an example, this equation may represent the consumption behavior of a group of households

Multivariate Linear Models
• Yi = β0 + β1 X1i + β2 X2i + β3 X3i + εi (i = 1,2, …,N) (1.11)

The Estimated Regression Equation
• The theoretical equation is purely abstract in nature
o Yi = β0 + β1 Xi + εi (i = 1,2, …,N) (1.14)
• The estimated regression equation has actual numbers in it.
o Ŷi = 103.40 + 6.38 X
• The estimated regression coefficients β0 + β1 with hat (see book) : are empirical best guesses of the
true regression coefficients β0 + β1 and are obtained from data from a sample of Ys and Xs.

How do we obtain data?
• We cannot perform controlled experiments (this is however possible in physics)
• Non experimental data
o Time series form: data collected from discrete intervals during time
o Suitable computer program: STATA & Eviews
• Cross section form: data collected on a moment in time for a group of households or firms
o Suitable computer program: STATA & SPSS
• A combination of both: panel data

,Chapter 2: Ordinary Least Squares
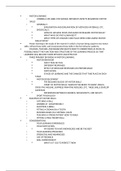
Example: The Economic Model
• S = 0 + 1 P + 2 A
o S: total sales for a given week
o P: average price for the hamburgers chain
o A: advertising expenditure
▪ P up → S up or down, because of the elasticity

Sales = price x quantity
→ Price goes up → sales goes up

Total, Explained and Residual Sum of Squares
• TSS =  (yt - mean(y))2
• For Ordinary Least Squares, the total sum of squares has two components, variation that can be
explained and variation that cannot be explained.

 (yt - mean(y))2 =  (ŷt - mean(y))2 +  (et )2
• (TSS) = (ESS) (RSS)
Total sum Explained sum Residual sum
of squares of squares of squares

• yt: value of the independent variable
• ŷt: estimated value of the independent variable
• et: yt - ŷt (estimated error)

2.4 Describing the overall Fit of the Estimated Model
• R2 = ESS / TSS =  (ŷt - mean(y))2 /  (yt - mean(y))2

o = 1 – RSS / TSS = 1 -  (et )2 /  (yt - mean(y))2
• 2
R = 87 %: 87% of the variation in total revenue is explained by the variation in price and the variation
in the level of advertising expenditure

Remember:
• ESS: Explained Sum of Squares
• RSS: Residual Sum of Squares
• TSS: Total Sum of Squares

One difficulty with R2 is that it can be made large by adding more and more variables, even if the variables
added have no economic justification
→ Error becomes smaller, R2 gets bigger (the bigger, the closer to the line).

An alternative measure of goodness of fit, called the adjusted R2 is computed as:
• R2adj. = 1 – [RSS / (N – K - 1)] / [TSS / (N - 1)]
• 1- as the number of variables K+1 increases; RSS goes down, but so does N – K -1. The effect on R2adj.
depends on the amount by which RSS falls.
• 2- R2adj. loses its interpretation

Alternative: the adjusted R2 can also be written as:
• R2adj. = R2 – [K / (N – K - 1)] * (1 – R2)

N: total number of observations
K: number of explanatory variables (excluding the constant term)
K+1: number of explanatory variables (including the constant term)

See Chapter 2 page 54

,R2adj. measures the percentage of variation of Y around its mean that is explained by the regression equation,
adjusted for degrees of freedom

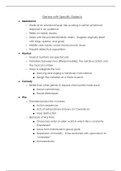
Adjusted R-squard (later collinearity): an example
An economist tries to estimate the relationship between direct labor costs and a few explanatory variables:
X2 : number of units produced
X3 : number of machine hours
X4 : Kilowatts of electricity

R2 = 0.87 R2 (adj) = 0.821
Yt = b1 + b2X2 + b3X3 + b4X4
Coeff. -130 4.58 8.64 -0.55
St error 1.15 5.11 1.70
T – value 3.98 1.69 -0.32

What do you see?

T-value = estimated coefficient/standard error

X3 (machine hours) and X4 (Kilowatt hours electricity) correlate and are causing collinearity
Correlation Matrix
Y X2 X3 X4
Y 1
X2 1
X3 1 0.94
X4 0.94 1

R2 = 0.86 R2 (adj) = 0.829
Yt = b1 + b2X2 + b3X3
Coeff. -137 4.68 7.08
St error 1.05 1.59
T – value 4.46 4.44

Which equation is better? I or II
A. Equation I is better because the R-squared is higher and you don't introduce ommitted variable bias
B. Equation II is better for multiple reasons: adj. R-squared is higher, all variables in equation II have
the correct sign and both dependent variables (X2 and X3) are significant

, 𝑦̂𝑡 = 40.7 + 0.1283𝑥𝑡 R2 = 0.317
St. error 0.03
T-values 1.84 4.20

Xt: weekly income (dollars)
Yt: weekly consumption of food (dollars)

Scaling the data
Xt: weekly income (measured in $100 dollars)
Yt: weekly consumption (measured in dollars)

0.001283xt (alternative A)
𝑦̂𝑡 = 40.7 +
12.83Xt (alternative B)

→ Alternatief B, omdat je Xt nu in $100 meet, en je yt gewoon in dollars wil hebben.

Xt: weekly income (dollars)
Yt: weekly consumption of food (in $100 dollars)

𝑦̂𝑡 = 0.407 + 0.001283Xt
No income → constant term = 0.407 (number of $100 dollars)

Yt and xt are measured in cents (rather than dollars)
𝑦̂𝑡 = 4070 + 0.1283Xt → xt doesn’t change because x and y are both measured in
cents

Alle Vorteile der Zusammenfassungen von Stuvia auf einen Blick:

Garantiert gute Qualität durch Reviews

Garantiert gute Qualität durch Reviews

Stuvia Verkäufer haben mehr als 700.000 Zusammenfassungen beurteilt. Deshalb weißt du dass du das beste Dokument kaufst.

Schnell und einfach kaufen

Schnell und einfach kaufen

Man bezahlt schnell und einfach mit iDeal, Kreditkarte oder Stuvia-Kredit für die Zusammenfassungen. Man braucht keine Mitgliedschaft.

Konzentration auf den Kern der Sache

Konzentration auf den Kern der Sache

Deine Mitstudenten schreiben die Zusammenfassungen. Deshalb enthalten die Zusammenfassungen immer aktuelle, zuverlässige und up-to-date Informationen. Damit kommst du schnell zum Kern der Sache.

Häufig gestellte Fragen

Was bekomme ich, wenn ich dieses Dokument kaufe?

Du erhältst eine PDF-Datei, die sofort nach dem Kauf verfügbar ist. Das gekaufte Dokument ist jederzeit, überall und unbegrenzt über dein Profil zugänglich.

Zufriedenheitsgarantie: Wie funktioniert das?

Unsere Zufriedenheitsgarantie sorgt dafür, dass du immer eine Lernunterlage findest, die zu dir passt. Du füllst ein Formular aus und unser Kundendienstteam kümmert sich um den Rest.

Wem kaufe ich diese Zusammenfassung ab?

Stuvia ist ein Marktplatz, du kaufst dieses Dokument also nicht von uns, sondern vom Verkäufer Brillantaisia_Coris.gaimard. Stuvia erleichtert die Zahlung an den Verkäufer.

Werde ich an ein Abonnement gebunden sein?

Nein, du kaufst diese Zusammenfassung nur für 5,49 €. Du bist nach deinem Kauf an nichts gebunden.

Kann man Stuvia trauen?

4.6 Sterne auf Google & Trustpilot (+1000 reviews)

45.681 Zusammenfassungen wurden in den letzten 30 Tagen verkauft

Gegründet 2010, seit 15 Jahren die erste Adresse für Zusammenfassungen
Starte mit dem Verkauf

Kürzlich von dir angesehen


5,49 €  1x  verkauft
  • (0)
  Kaufen